Posts

Talk at MCLS 7 August 2020

  Title: Learning the number sequence: preschool children make sense of numbers Here you can find the slides of my talk.

Talk at MEC seminar 6th May 2020

Here you can find the slides of my talk at MEC seminar planned on the 6th of May 2020.

Poster at BCCCD 2020

10th annual BCCCD meeting Budapest, Hungary  January 9-11, 2020. Poster Session B  Date: 10th January Time: 14:30 - 16:30 Location: First floor Poster:  PB.e-037 A-0111  Learning the number sequence: preschool children make sense of numbers Francesco Sella 1 , Daniela Lucangeli 2 , Roi Cohen Kadosh 3 , Marco Zorzi 2 1 University of Sheffield, UK; 2 University of Padova, Italy; 3 University of Oxford, UK. Abstract: Learning how symbolic numbers represent exact quantities is a cornerstone in the development of early numeracy skills. We explored how the mastering of different numerical concepts relate to symbolic magnitude knowledge, as assessed in number comparison tasks. We used a give-a-number task to classify preschool children in subset-knowers and cardinal-principle (CP) knowers. We implemented a direction task to assess children’s understanding of the directional property of the counting list: that is, adding one item to a set leads to the nex...

Scientific plots using ggplot2 in R

Image
Below you can find the R code to create a publication-ready plot. You can change the details of the theme() functions to tail the plot to your needs. # Loading required libraries library(ggplot2) library(grid) # Load the function theme_science1 <- function(base_size = 18,                            facet_border_col = "white",                            legend_justification = c(0,1),                            legend_position = c(0,1)){   theme_bw(base_size = base_size) +   theme(axis.line = element_line(size = 0.7, color = 'black'),             panel.border = element_blank(),             panel.grid.major = element_line(size = 0.1, color = "grey90", linetype = "dotted"),       ...

A simple function to create a regression output in R

Image
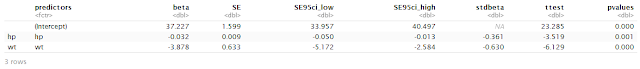
There are several ways to create an output of regression analysis in R. This is a simple custom made function. # Clear all rm(list=ls()) # Libraries library(QuantPsyc) # Regression summary function table_lm <- function(lm_object, digit_rounding){   summary_lmobject = summary(lm_object)   df_output = data.frame(   predictors = names(lm_object$coefficients),   beta = round(as.numeric(summary_lmobject$coefficients[,1]), digit_rounding),   SE = round(as.numeric(summary_lmobject$coefficients[,2]), digit_rounding),   SE95ci_low = round(as.numeric(confint(lm_object, level = 0.95)[,1]),digit_rounding),   SE95ci_high = round(as.numeric(confint(lm_object, level = 0.95)[,2]),digit_rounding),   stdbeta = c(NA,round(lm.beta(lm_object), digit_rounding)),   ttest = round(summary_lmobject$coefficients[,3], digit_rounding),   pvalues = sapply(as.numeric(summary_lmobject$coefficients[,4]),             ...

Plotting pre-post results in R

Image
A quick code to create a useful plot to visualise pre- and post-test results. I was inspired by this  post , this  post , and this  post . A scatterplot between pre-test and post-test scores for the control and the training group is presented. The straight black lines represent correlations between pre-test and post-test scores within the two groups. The straight lightgrey line represents the same values at pre-test and post-test –> Subjects above the line display a better performance at post-test compared to pre-test. At the margins, the boxplots are reported as well as the mean (i.e., diamond) and 95% confidence intervals (i.e., error bars). In the case of the post-test scores (plot on the right margin), the adjusted means (i.e., black triangles) and associated 95% confidence intervals (i.e., error bars) are reported. The table reports the results for the ANCOVA and its assumptions. In this example, participants in the training group show an improvement in a Working ...

Reporting Bayes Factor in regression analysis

A quick function to extract and report large Bayes factors as a power of 10 when running a regression analysis. The function takes the output of regressionBF (Package BayesFactor: Morey & Rouder, 2018), extracts the BF and converts into a format for Rmarkdown. # A function to extract and report Bayes Factors BF_scirep_str <- function(model) { output <- formatC(round(extractBF(model, onlybf = T)), digits = 3) output <- sub("e", "x10<sup>", output) #Replace e with 10^ output <- sub("\\+0?", "", output) #Remove + symbol and leading zeros on expoent, if > 1 output <- sub("-0?", "-", output) #Leaves - symbol but removes leading zeros on expoent, if < 1 output } An example: # Library library(BayesFactor) # Regression model model <- regressionBF(mpg ~ hp + wt, data = mtcars) model ## Bayes factor analysis ## -------------- ## [1] hp : 56963.84 ±0.01% ## [2] wt : 45657981 ±...